Image Log Interpretation Services
Answering your questions: structural dip, fractures, faults, stratigraphy
Integrate results with our quick-look analysis of the open-hole logs
Interpretation grounded in the local geology
Old Dipmeter Resurrection - New Service!
PayZone Inc. offers full-service borehole image log analysis. Our team is led by Tom Howard, a geologist with training in image logs from two service companies and a wide experience the logging industry, backed up by a capable group of analysts. We take an individualized approach to image logs to ensure you the most value from this technology. For the interpretation, we use TERRASCIENCES INC. software, a powerful and versatile system with excellent support.
Image logs have been called a "temperamental" technology, requiring a combination of art and science for successful implementation. The skill and knowledge of the interpreter is critical to the quality and value of the results, but it is equally important for us to understand the local geologic setting, why you ran the log, and what you want to learn from it. Then we will direct the interpretation to focus on the answers you need.
We will also interface with the service companies to ensure that all the necessary information is available to interpret the image logs correctly and which you, the client, will need for your data archive so that you will be able to go back to that log in the future and perform further interpretation.
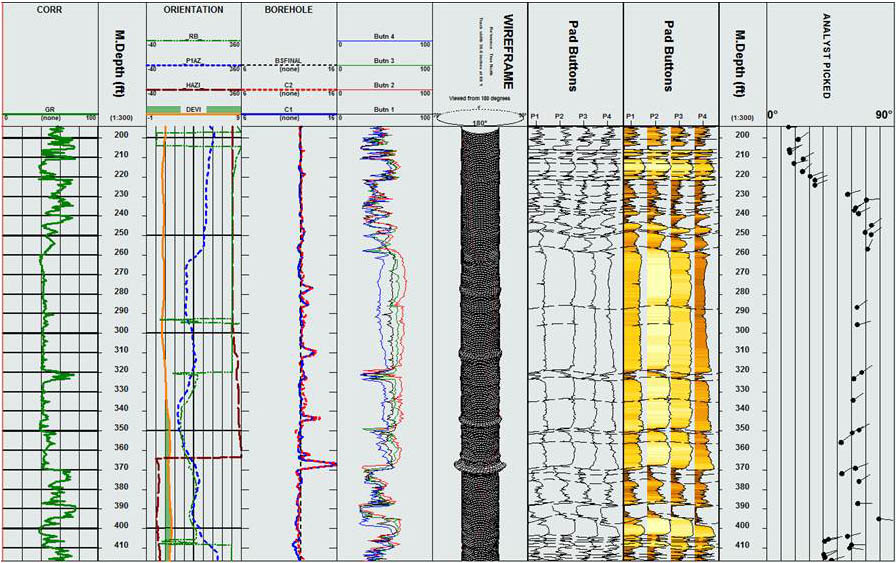
One of the most important tasks in image log work is categorizing the observed dips, which consists of assigning them to structural dip, bedding (cross bedding, channels, slumps, etc.), fractures, and other features. To assist in identifying and assigning types of dips, a quick-look petrophysical analysis of the open-hole logs can optionally be included with the image log interpretation. Not only is this an added value, but knowledge of the rocks penetrated by the well and their properties allow us to better understand the features we see on the image logs.
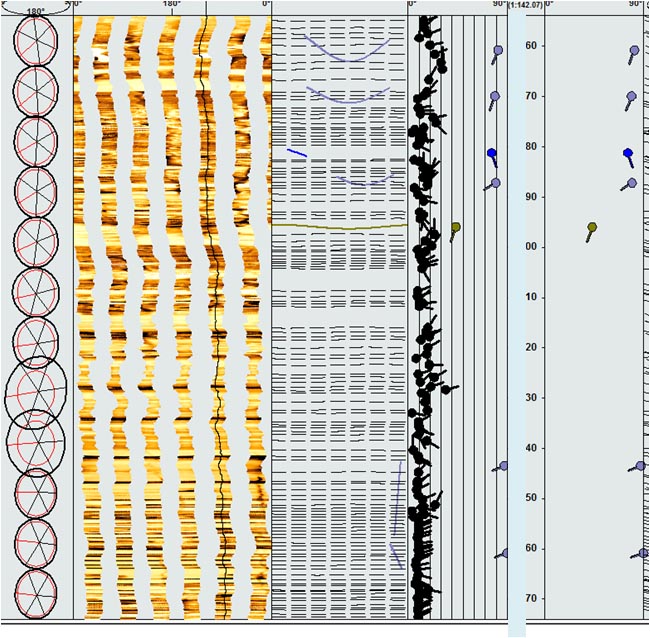
Here is another unusual example of an apparent change with depth in the stress field orientation as indicated by borehole breakout. In the depth view (right), the high-angle gray dips indicate the orientation of drilling-induced fractures, which are often indicative of the stress field. Note that the azimuth of these fractures is SSW at the top of the section, but swings around to SW with depth. The long axes of the borehole ellipses (far left) show this migration also. Black low-angle events are structural dip.
The right hand track clearly indicates the two distinct populations of fracture orientations.
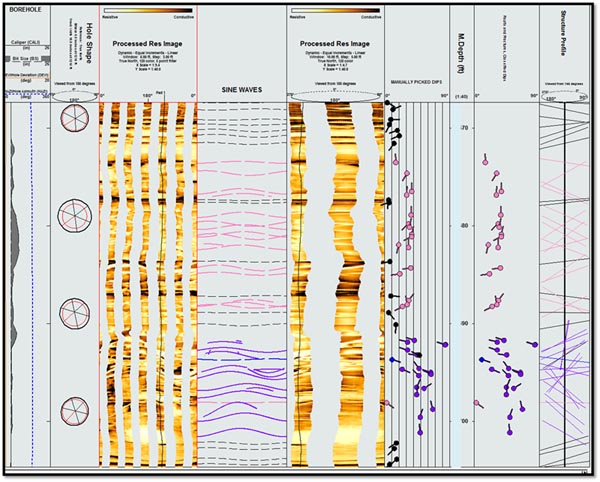
We have had good success in capturing 4-arm dipmeter raw curves from 5" log plots and processing them as pseudo-image logs. If the original log data are valid, these logs produce consistent structural dip information that can be used alone or with image log data on new wells to help define geological relationships. Sometimes the auto-dip routines applied to the data did not define dips well, especially if they are high-angle and the parameters were not set correctly. This is an excellent way to obtain the benefits without the need for an extensive drilling and logging campaign. Below is an example of the results we obtained from the interpretation of 4-arm dipmeter data digitized from a 5" log plot. The data are very usable and showed good consistent structural dips. The original automated interpretation had not captured the very high-angle dips, which were not recognized to exist in the area until the operator collected a series of image logs in new wells. When we went back to these older dipmeters, a new interpretation showed that the steep dips were present in these wells also.